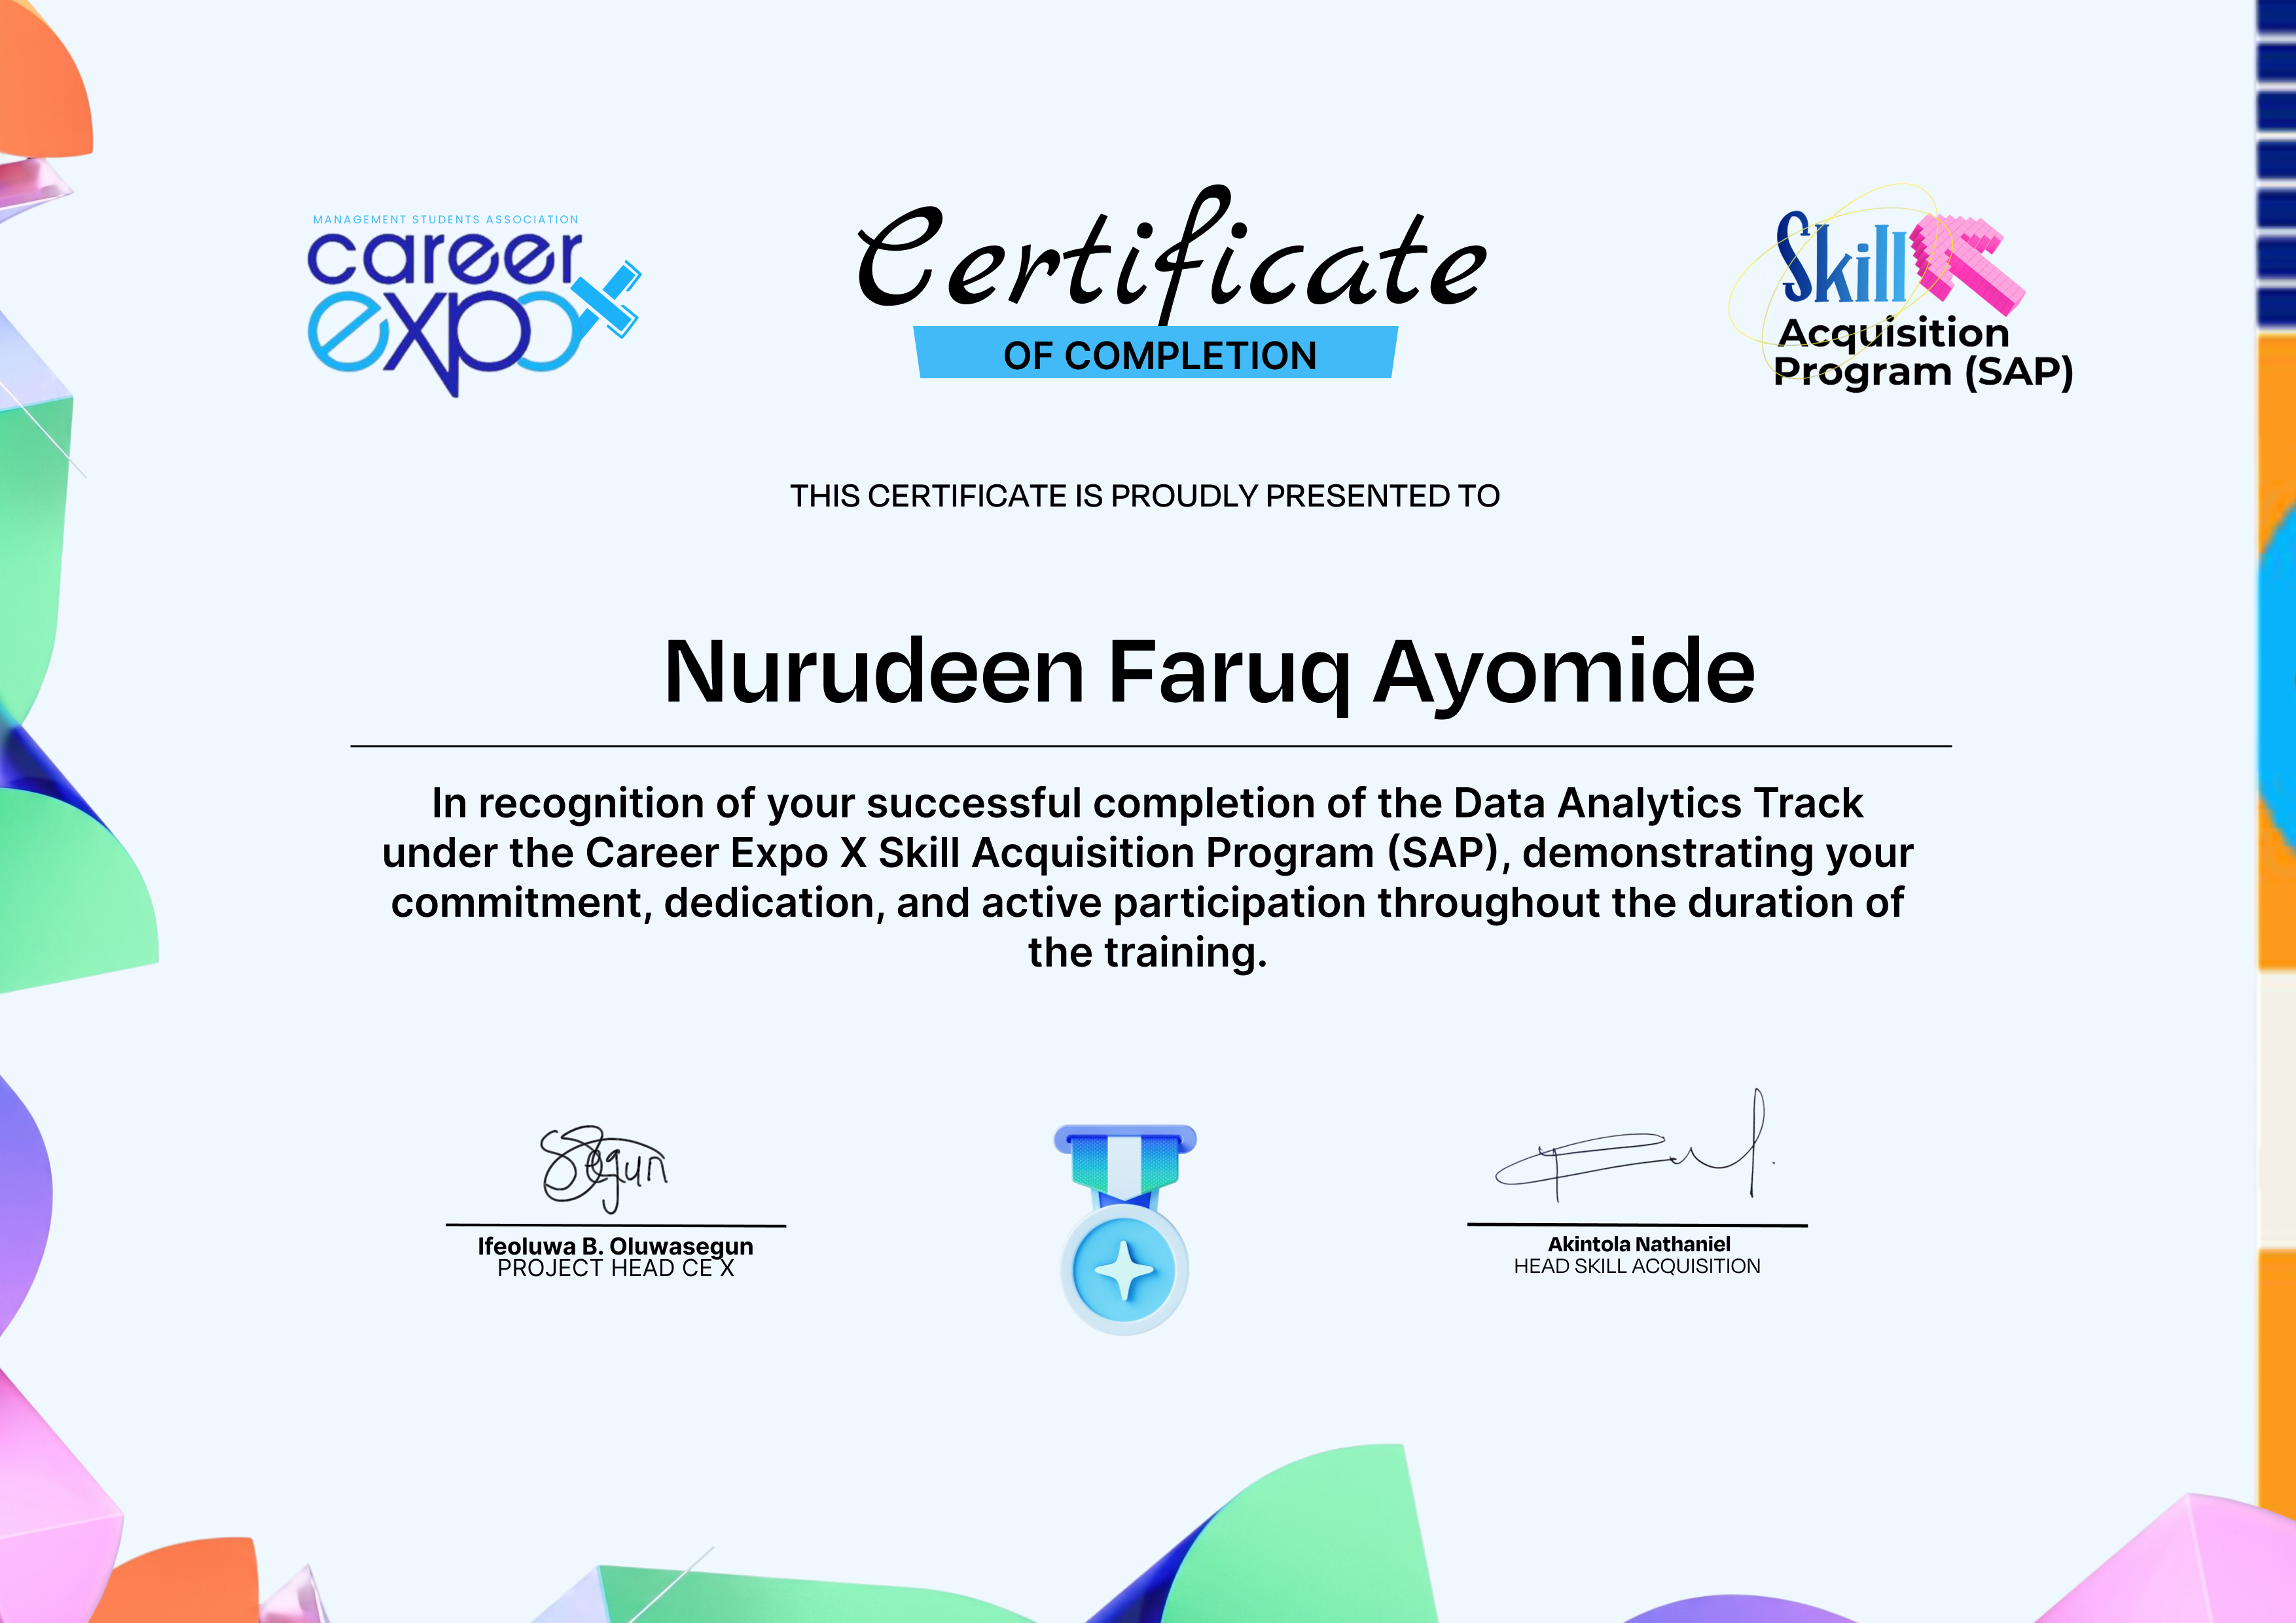
Detailed Finance Student & Aspiring Financial or Data Analyst and Data Scientist
Yaba, Lagos, Nigeria.
About
I am a detail-oriented Finance student with hands-on internship experience at Beckley Roberts & Co., a chartered accounting firm, where I honed my skills in data entry, financial record management, and transaction verification. Beyond coursework, I've built several independent machine learning projects end-to-end including a produce price forecasting model covering data cleaning, feature engineering, model comparison, hyperparameter tuning, and deployment. I combine strong analytical thinking with a meticulous approach to ensure data accuracy and reliability. Currently pursuing a Bachelor's degree in Finance at the University of Lagos, I am eager to apply my finance background and growing data science skill set to a Data Scientist or Data Analyst Intern role, contribute to data-driven insights, and grow as a data scientist within a forward-thinking, collaborative team.
Work
Beckley Roberts & Co. (Chartered Accoutants)
|
Junior Accountant (internship)
Surulere, Lagos, Nigeria, Nigeria
→
Summary
Managed financial records and transactional data accuracy for a chartered accounting firm, developing robust data management and analytical skills applicable to supply chain operations.
Highlights
Organized and meticulously maintained critical financial records, ensuring audit readiness and supporting accurate financial reporting for the firm.
Executed precise data entry and verification of financial information, upholding 99%+ accuracy in high-volume transactions, directly contributing to reliable data for analysis.
Conducted thorough reviews of transactional data, identifying and rectifying discrepancies to guarantee data completeness and integrity essential for informed decision-making.
Utilized structured datasets to perform foundational data cleaning and interpretation, enhancing data quality and preparing information for further analytical processes.
Education
University of Lagos
Akoka, Lagos, Nigeria
→
Bachelor'sFinanceGrade: First Class
Yaba College of Technology
Yaba, Lagos, Nigeria
→
ND(National Diploma)Banking and FinanceGrade: Distinction
• Built an end-to-end forecasting pipeline for tomato and onion prices using 10 years of Nigerian market price data (51 markets, 2016-2026).
• Performed EDA that identified a currency-driven distortion in the raw price series (2023 naira float) and corrected for it by forecasting USD-denominated prices instead.
• Engineered time-series features including lag variables, rolling means/std, month-over-month change, and cyclical seasonality encoding.
• Trained and compared three models (Linear Regression, Random Forest, XGBoost) using MSE and RMSE; selected Random Forest as best performer for both commodities.
• Tuned the selected model with RandomizedSearchCV and TimeSeriesSplit cross-validation to prevent temporal data leakage, improving RMSE without overfitting.
• Deployed the final model as an interactive Streamlit web app that accepts recent price history and returns a next-month price forecast.
Sales Data Analysis with Excel
Tools: Microsoft Excel (Formulas, VLOOKUP, PivotTables)
Summary
• Formatted a raw sales dataset professionally with currency, date formatting, frozen headers, and autofit.
• Created a summary sheet calculating total sales, average, min, max, and transaction count using formulas.
• Added calculated columns for Profit (Sales - Cost) and Profit Margin (High/Medium/Low using nested IF).
• Used COUNTIF to analyze transaction distribution by Sales Channel.
• Used SUMIF to calculate total revenue by Country.
• Built a VLOOKUP tool for dynamic customer data retrieval based on Sales ID.
• Created PivotTables summarizing sales by Sales Rep, Country, and Product.
Marketing Campaign Performance Dashboard
Tools: Microsoft Excel (PivotTables, Charts, Slicers, KPI Cards)
Summary
• Built an interactive Excel dashboard analyzing a marketing campaign dataset (impressions, clicks, conversion rate, acquisition cost, ROI across channels, locations, and audiences).
• Designed 5 KPI cards summarizing total impressions, clicks, conversion rate, acquisition cost, and ROI, each linked live to underlying PivotTable data.
• Built 11 PivotTable-driven charts breaking down performance by week, location, channel, campaign type, and target audience, including month-over-month trend comparisons.
• Added a timeline slicer for interactive date-range filtering across the dashboard.
• Applied a custom, consistent color scheme with proper chart titles and data labels throughout.
• Structured the workbook with separate Dashboard and Data sheets following dashboard-design best practices.
Retail Sales Data Cleaning Project
Tools: Python (Pandas), Excel, Jupyter Notebook
Summary
• Analyzed a deliberately dirty retail sales dataset (10 columns, 26 rows) to identify data quality issues.
• Identified and categorized issues: missing values, duplicates, outliers, and inconsistent formatting.
• Cleaned the dataset by handling null values, removing duplicates, standardizing formats, and correcting outliers.
• Documented all findings and cleaning decisions in a detailed cleaning report (PDF).
• Maintained original raw data and created a separate cleaned version following best practices.
Water Quality Analysis: From Data Cleaning to Visualization
• Loaded and inspected a real-world water quality CSV dataset to assess data structure and quality.
• Cleaned and preprocessed data by handling missing values, outliers, and formatting inconsistencies.
• Generated summary statistics to identify trends and support regulatory compliance monitoring.
• Calculated correlation matrices using Pandas to uncover statistical relationships between chemical levels.
• Created annotated heatmaps using Seaborn to visually communicate insights for decision-making.
• Built a complete, reproducible Jupyter Notebook demonstrating end-to-end analysis workflow.
Skills
Data & Financial Tools
Microsoft Excel (Advanced Functions, Pivot Tables, Interactive Dashboards, KPI Cards, Slicers, Data Formatting, Conditional Formatting, Data Modeling, Financial Forecasting, VLOOKUP/XLOOKUP), Microsoft Word (Documentation & Reporting).
Data Management
Data Cleansing & Transformation, Database Management, Record Keeping & Archiving, Data Validation & Quality Assurance, Transaction Reconciliation.
Analytical & Technical
Financial Data Interpretation, Variance Analysis, Quantitative Research, Problem-Solving & Root Cause Analysis, Critical Thinking.
Python (scikit-learn), Random Forest, XGBoost, Linear Regression, Time Series Feature Engineering, Model Evaluation (MSE/RMSE), Hyperparameter Tuning (RandomizedSearchCV), TimeSeriesSplit Cross-Validation, Streamlit App Deployment.
Languages
Arabic
Basic
Yoruba
Native
English
Fluent
Interests
Data Science, Data Analytics, AI & Machine Learning